Speaking the “business language” is to condense energy data into easy-to-read numbers and figures
By Victor Ballestin Trenado & Vicente Garcia, EFINETIKA, José Martin Manuel Rapún, INYCOM, SPAIN 13. August 2019
 Inycom is an Energy Services Company (ESCO) in Spain which calculates Energy Performance Indicators (EPI). By EPI, it is possible to monitor performance, like fluctuations and comparisons for energy optimization.
Energy Performance Indicator (EPI) can be important information for plants, science parks, municipalities etc. in greener investment decisions and for future planning of business optimization. E-LAND can benefit from EPI’s to benchmark performance of electricity islands. In this article, Inycom shows how to calculate EPI based on a case from a production plant.
Bottle plant as showcase
We take off using data from a water bottling plant, just as an example. By using data from a technical report, we will show how we calculate an EPI and the inherent energy baseline. Basic data is electricity consumption and variables are different industrial KPI’s, which can be used to assess energy performance and to improve energy efficiency.
In this showcase, we analyse monthly energy consumption data of our customer together with internal and external variables in order to study the possible correlations. Through this analysis we can find out and choose the operating variables that may be critical in the energy system:
- Energy Performance Indicators: Parameters depending on a series of variables that influence energy consumption levels; therefore, we will be able to evaluate consumption with a higher level of objectivity.
- Energy Base Line: We estimate a mathematical formula to deduct the expected electricity consumptions, and then to compare it with the real ones. Our goal is to establish improvement objectives.
Defining the strongest variable
First, we have to study the influence of the key industrial variables in energy consumption. In order to analyse this correlation, we will use a linear regression model. We search for an equation (y=ax + b) that helps us to define the relation between variables. The correlation degree between both variables (x and y) is R², with values between 0 and 1. A correlation degree is an outcome of a sensitivity analysis (statistics) and is better the closer it comes to 1.
The controlled industrial variables we are using in this case are the following:
- 5L bottles
- 1,5L bottles
- 0,5L bottles
- 0,33L bottles
- Total volume (liters of water)
- Total number of bottles
We can see in the following figure the relation between electricity consumption and the analysed variables:
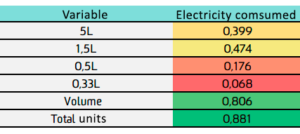
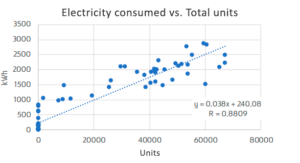
The most representative variable is the total number of bottles, with R² of 0,8809, as displayed in the next chart.
Energy Performance Indicators
After the study of correlations described in the previous section, we are able to determine the following indicators as the most representative:
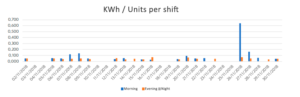
- Main Energy Performance Indicator: kWh/bottle
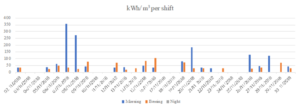
- Secondary Energy Performance Indicator: kWh/m3
The next figure shows the main indicator values during one month of analysis (November 2018). During this month, the average value was of 0,052 kWh/bottle for the main indicator.
Looking at the secondary EPI during this month, the average value was of 41,05 kWh/m3 bottled.
Energy Base Line
Next, we will show the results of the statistical study using a linear regression model which helps to identify the relation amongst the industrial production variables and the electricity consumption. The resulting equation of electricity consumption in terms of the number of different types of bottles (size in litres) produced is:
| Electricity consumption = 242,455 + 0,0718696 × 5L + 0,0397612 × 1,5L + 0,0314133 × 0,5L + 0,0286907 × 0,33L |
Statistically speaking, it is obvious that the coefficient applied to each bottle size is not proportional to the volume capacity. Figuratively speaking, this means that an 0,33L is most energy consuming per liter contained (low coefficient equals high energy intensity) and therefore less environmentally friendly.
And the next chart displays the comparison between real electricity consumption level and the calculated base line using the previous formula for one month:
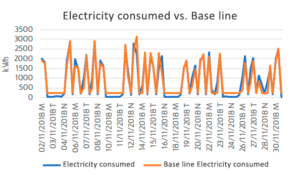
The R² correlation indicator between both lines is 0.904.
Who is Inycom?Inycom is partner at pilot WALQA Technology Park in Spain, integrating and demonstrating the benefits of the multi-vector toolbox developed in the project. Inycom is an ESCO (Energy Services Company) with headquarters in Zaragoza. In the Energy Sector, Inycom provides services like measurement and data acquisition, energy efficiency, intelligent SCADAs, demand and generation forecasts and electricity markets assessment. Inycom is dedicated to R&D in energy, more specifically in renewable energy and their integration in the power grids. |
||
Social media
E-LAND updates

The E-LAND project aims to develop and demonstrate tools for energy systems to overcome the technical, business, and societal challenges associated with the creation of… (1 year ago)

E-LAND exploitation enhancement activities kickstarted for the final project year Multiple events were executed and many more are planned for the E-LAND project’s final year.… (1 year ago)

A central pillar of the E-LAND project's is risk management. The Norwegian consortium member, Institute for Energy Technology (IFE), implemented a risk management approach to… (2 years ago)

E-LAND H2020 is working with creating a toolbox that is designed to optimize and control multi-energy islands and isolated communities. The toolbox is structured in… (2 years ago)

Smart Innovation Norway together with the University of St. Gallen have developed a series of workshops that began in June 2021 and focused on the… (2 years ago)

About the pilot site: Port of Borg is situated in an industrial area on a small peninsula called Øra just outside Fredrikstad, Norway. Port work… (2 years ago)

Since the mid-1960s, the township of Auroville in Southern India has been striving for sustainable living and the realization of human unity in diversity. In… (2 years ago)